Monitoring & Observability with Prometheus and Grafana
Modern infrastructure moves fast. Containers scale up and down, cloud instances come and go, and new deployments happen multiple times a day.Without strong monitoring and observability, teams are flying blind — unable to detect issues before they impact users.
That’s why more and more organizations rely on Prometheus and Grafana to gain visibility, automate alerts, and ensure reliable operations.
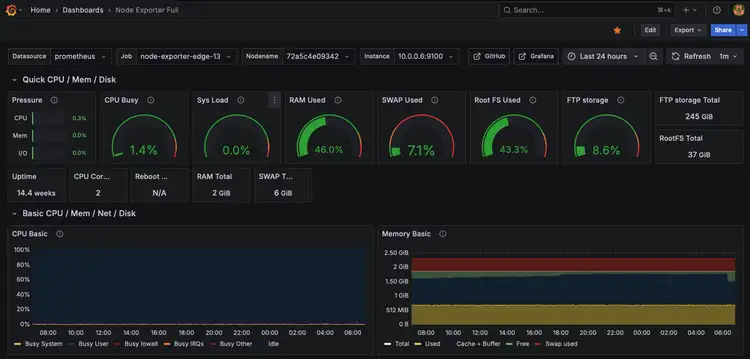 A glimpse into ftpGrid.com edge storage using Grafana
Why monitoring matters in DevOps
Monitoring is not just about collecting metrics — it’s about understanding why something is happening.A mature monitoring setup allows teams to:
Detect problems early and act before downtime occurs.
Correlate metrics, logs, and traces for full visibility.
Optimize performance and capacity planning.
Build a proactive culture around reliability and incident response.
This is the essence of observability — being able to ask new questions about your systems without changing the code first.
Prometheus: the backbone of metrics
Prometheus is the de facto standard for collecting and storing time-series data in DevOps environments.It scrapes metrics from your applications, services, and infrastructure using lightweight exporters — and stores them in a powerful queryable database.
With Prometheus, you can:
Collect metrics from servers, containers, and applications.
Use PromQL to define complex alerts and queries.
Monitor SLAs, performance, and system health.
Automate alerting via Alertmanager with email, Slack, or webhook notifications.
Grafana: turning data into visibility
While Prometheus stores the data, Grafana makes it visual.With Grafana dashboards, teams can:
Create live visualizations of key metrics.
Build role-based views for DevOps, management, or support.
Correlate system performance, logs, and alerts in one interface.
Set thresholds and generate real-time alerts when something deviates.
A well-built Grafana dashboard becomes the nerve center of operations — from early warnings to post-incident analysis.
From metrics to action
At Devanux Monitoring & Observability, we help organizations design monitoring setups that combine Prometheus, Grafana, and Alertmanager in a scalable and maintainable way.We also integrate additional tools like Node Exporter, cAdvisor, and Blackbox Exporter for full-stack visibility — from infrastructure to application level.
Our focus is on practical DevOps monitoring: simple, consistent, and with alerts that make sense — not noise.
Conclusion
Observability is the backbone of modern DevOps.By combining Prometheus for metrics, Grafana for visualization, and Alertmanager for smart notifications, teams gain full control over system health and performance.The result? Fewer incidents, faster recovery, and more confidence in every deployment.